How to read my charts
As you have definitely noticed, I am using certain symbols for entering and exiting trades. I think they are selfexplanatory but just in case to precede a confusion I have decided to cover them shortly here.
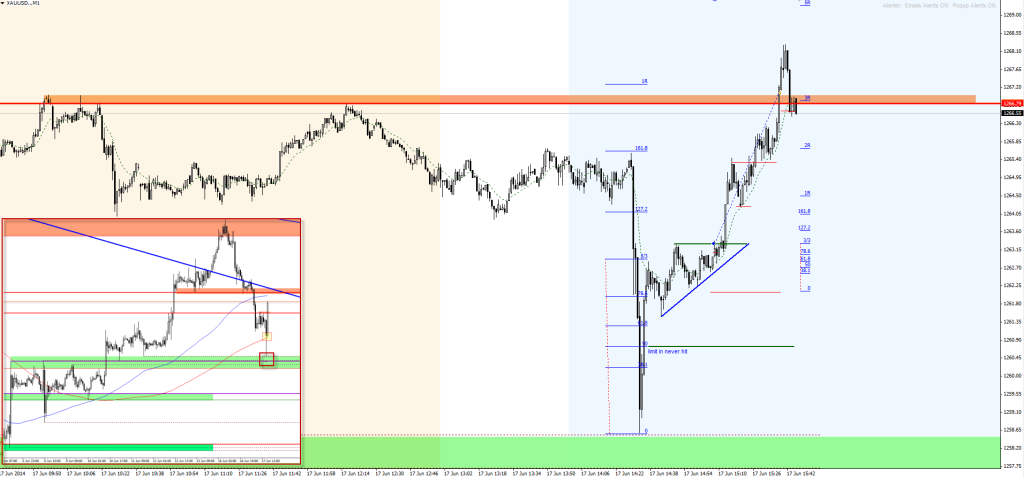
On my screenshots you are going to see mostly symbols above, orange and blue zones & R extensions:
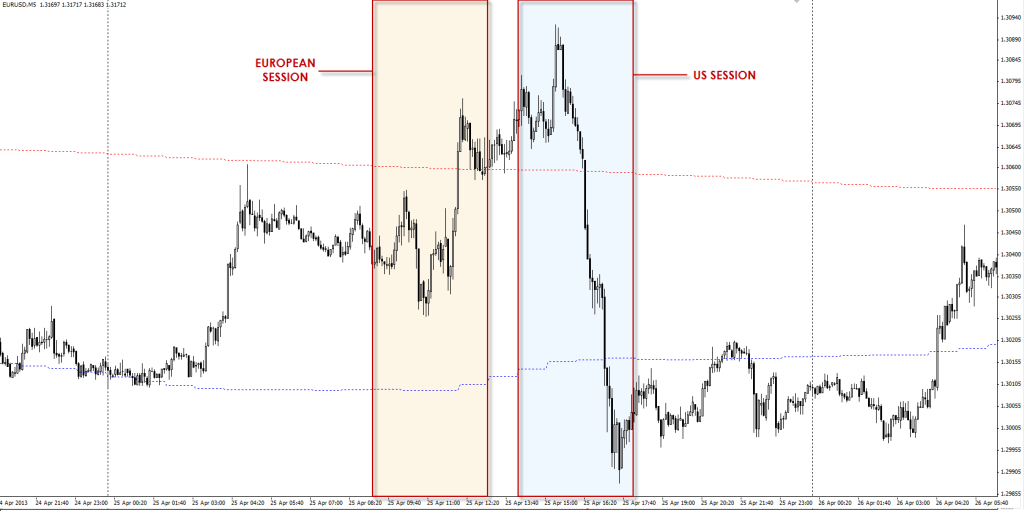
- orange zone (or oldlace to be precise) represents a EUROPEAN session (9:00 – 12:00 GMT+1)
- blue zone (or aliceblue to be precise) represents a US session (13:00 – 17:00 GMT+1)
- R extension measures number of R’s. For one distance of stoploss = R, how much profit I can get (how many R’s I can get). Usually I am interested in trades with +2.5R and higher. If for example at 1.5R is a major sup/res I usually do not take the trade or take with with lower size.
European (OldLace color) and US (AliceBlue color) session:


Leave a Reply